Are you richer than before the pandemic? It probably helped if you were well-off already
Did your household emerge from 2020 better or worse off?
If your answer was unfortunately the latter then you are probably in the minority.
For, while millions of people were put on furlough last year when the pandemic struck and some were unlucky enough to lose their jobs altogether, overall household wealth grew during the year.
According to the Office for National Statistics (ONS), household net worth grew by 8.4% in 2020 to a total of £11.2trn.
With the exception of 2014, it was the fastest annual rate of growth since the global financial crisis, while it was only very slightly below the pre-crisis average growth rate of 8.5%.
As a result, at the end of 2020, household wealth in the UK stood at an all-time high.
The ONS provides a number of reasons for the increase.
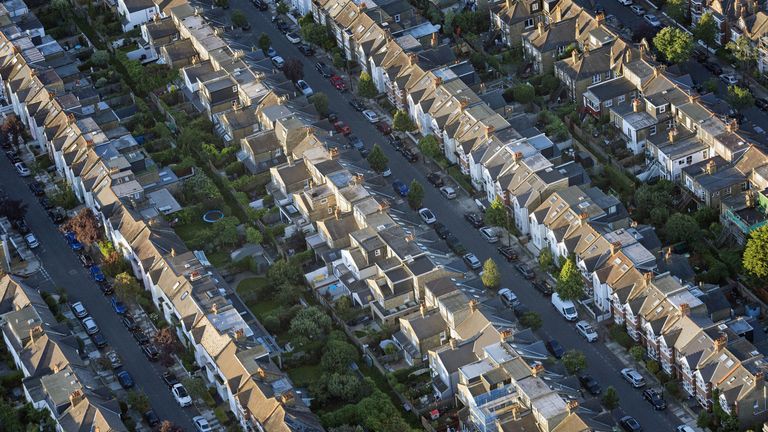
Two-fifths of it came from land, chiefly a result of a 7.3% rise in house prices, which the ONS says “was likely to have been affected by the reduction in stamp duty rates”.
Almost as significant a contributor to the rise in household wealth was a rise in the value of insurance and pension schemes.
The ONS says this was due mainly to a rise in the value of defined benefit – final salary in the jargon – pension schemes.
These, the ONS notes, became more valuable due to the fall in gilt (UK government IOU) yields.
Gilt yields are used to calculate the liabilities of a pension fund – in other words the future pay-outs it must make to retirees – and, when they fall, it increases the size of a fund’s liabilities.
Higher liabilities, in essence, mean the cost of future pension pay-outs to retirees rises, making the promise of those pay-outs more valuable to scheme members.
Gilt yields, which fall as the price of a gilt rises, came down last year as the Bank of England revived its asset purchase scheme – quantitative easing in the jargon – at the height of the pandemic.
The third factor behind the rise in household wealth, accounting for just over one-fifth of the increase, was a rise in the value of bank deposits.
This, as the ONS notes, is consistent with a sharp rise in the amount of savings salted away by households.
This took off during 2020 as households were unable, during the lockdown, to spend as much money on activities such as restaurant meals, nights out and holidays.
It is possible to deduce from this the kind of households that will have enjoyed the biggest increases in household wealth.
The average age of a first-time buyer is now 34 so, with the rise in house prices, the over-34s are likely to be key beneficiaries.
Similarly, as final salary pensions are more widespread among public sector workers and older private sector workers, they are likely to have benefited most from the increase in the value of these particular assets.
Other studies have established that younger adults without dependent children were the most likely to see an increase in their family’s cash savings during the pandemic while young adults with children were more likely to see their savings run down.
So the key beneficiaries are likely to be older homeowners or young adults without children and those who have a final salary pension, in other words, people who were already pretty well-off.
It confirms a body of evidence already published by some researchers in the insurance sector and organisations like the Institute for Fiscal Studies and the Resolution Foundation.
The losers, meanwhile, will have been younger workers yet to get on the housing ladder, younger families with dependent children, the unemployed and those who did not already have some savings set aside.
As the Resolution Foundation noted in a report published at the end of October: “Recessions normally bring about big falls in household wealth, usually as a result of falling house prices, but the unique nature of the COVID crisis has driven a wealth boom.
“However, this unlikely pandemic wealth boom has not been shared evenly across age cohorts.
“Those aged 50 and over account for 63% of the increase in total wealth during the pandemic, compared to just 13% for under 40-year-olds.
“The pandemic is therefore likely to have widened the already huge generational wealth gaps across the UK.”
If the net wealth of households rose during the pandemic, the ONS calculates, the net worth of the government fell.
The ONS estimates that the government’s net worth fell during 2020 by £445bn to -£1.494trn.
This was the largest fall on record and due mainly to a rise in government liabilities – the sums the government must pay in future – partly reflecting higher public spending, on borrowed money, during the pandemic.
In the round, though, the UK’s net worth rose during 2020 by £500bn to £10.7trn.
Divide that up by the population as a whole, the ONS says, and that works out at £159,000 per person.
It represents the strongest growth since 2016.
That’s the good news.
The bad news, according to the ONS, is that the increase was “predominantly driven by an increase in the value of non-produced assets which almost entirely consist of land”.
The ONS data today confirms a number of things that were already suspected about the impact of the pandemic on household finances: that older people are likely to have emerged better-off from the crisis, particularly if they are a homeowner or have a final salary pension.
Meanwhile younger people without homes or financial assets to begin with were more likely to have emerged worse off and certainly are likely to have been left comparatively worse off.
In other words, the wealth gap between the generations, which was already significant, widened.
That poses a big challenge that may prove hard for the government to meet.
It is committed to “levelling up” inequalities between London and the Home Counties and other parts of the country.
That is difficult enough.
But reducing the inequalities between, say, a retired homeowner in the north-east of England with a generous public sector pension and a young person of working age paying rent in an expensive inner London borough with few, if any, financial assets will be harder still.


