The latest inflation figures, on the face of it, contain little to worry us members of the public because the headline measure fell back.
The Consumer Prices Index (CPI) which charts the price adjustments in a basket of goods and services, eased from an annual rate of 3.2% to 3.1% in September.
The rate has climbed sharply this year as a reopening of the economy from COVID-19 restrictions gathered steam but complicated by supply constraints – a consequence of the global economic machine being unable to match demand.
Here we examine where prices have been rising at the steepest rates for consumers, according to the latest data from the Office for National Statistics (ONS):
‘Consumers are really going to feel the pinch’• Fuel
AdvertisementThe largest upwards contribution to the latest inflation figures came from transport costs.
The ONS noted that average petrol prices stood at 134.9 pence per litre in September compared with 113.3 pence per litre a year earlier.
More from BusinessIt said that the September 2021 price was the highest recorded since the same month in 2013 and, crucially, it did not reflect the impact of the fuel delivery crisis late last month as it fell outside its price collection window.
Government data has since shown that average unleaded costs hit almost 140 pence per litre at the end of last week and the Petrol Retailers’ Association has warned that drivers will see record costs for both unleaded and diesel by the end of this month.
Image: The ONS data was collected too early to reflect rising fuel costs amid the delivery crisis that sparked panic buying• Used Cars
There has been strong demand for used cars since the summer as new vehicle production has been hampered by the global shortage of semiconductors and people continue to seek alternatives to public transport.
The ONS said prices made the largest contribution to inflation since February 2010.
It reported a 2.9% in September alone leading to a cumulative increase of 21.8% since April.
• Furniture & Household goods
Furniture and furnishings have been in high demand as the end of pandemic restrictions have prompted households to replace well-worn stock.
Image: The end of lockdowns has prompted households to venture out and replace furnishings Pic: Pets At HomePrices in this category increased 3.8% in September, compared with 1.5% in the same month a year ago.
The data charted rises from glassware, tableware and household utensils.
• Food
The ONS noted a slight rise in food costs during September – signalling the end of food deflation.
While it said that the increase was offset by smaller increases in the cost of non-alcoholic drinks, a separate report using industry data showed grocery prices increased 1.7% in the four weeks to 3 October.
Strong competition between supermarket chains is expected to limit the pace of price increases in the months ahead though surveys have also shown growing shortages of some products as a result of the supply chain problems.
Image: While grocery costs are going up, stiff competition among supermarkets should limit the extent of the increases at tills• Housing
The cost of owning, maintaining and living in one’s own home – known as occupier’s costs – was another upwards pressure on inflation in September.
The report pointed to higher bills for rents and liquid fuels as being the main drivers of the increase.
• Household Energy
This is where we come to the forward-looking bit. The ‘elephant in the room’, if you like.
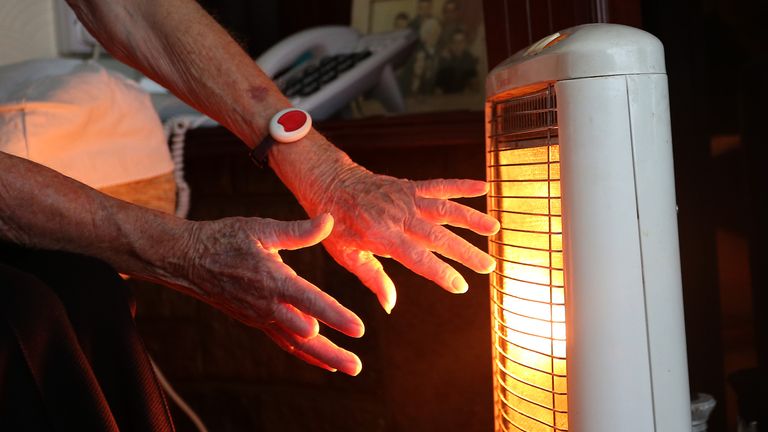
Because there are around 15 million homes on so-called default tariffs which are controlled by the government’s price cap, the inflation figures for October are tipped to show a marked increase.
That is because a 12% increase in the cap has now taken effect to reflect the record surge in wholesale energy costs.
Some economists believe that if the prices were to be fully reflected at the next review of the cap’s level, bills could rise by a further 30% from April.
